
1. The Core Challenge of Measuring Transformation
Measuring the impact of change is nothing new; organizations face this challenge during every transformational wave. Whether implementing Agility, shifting to matrix structures, or executing digital and cloud transformations, leadership teams always confront the same fundamental question: “How do I know this is delivering value?”
The theoretical answer is straightforward, applying to any corporate change initiative: “We evaluate the state before the change, the state after the change, and calculate the net difference.”
Typically, this trajectory follows a classic J-curve model:
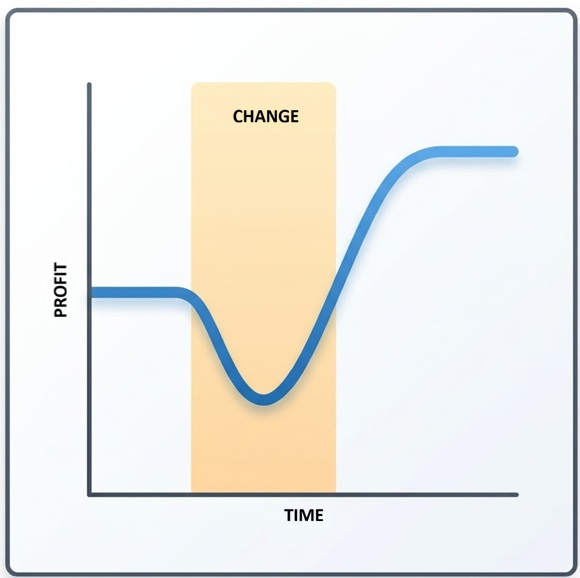
While this conceptual model appears simple, several practical obstacles typically impede effective measurement:
- The Baseline Deficit: The organization failed to measure the state before the initiative, resulting in a lack of baseline data.
- Objective Blindness: Leadership lacks clarity on what to measure because the strategic goals of the transformation were never precisely defined.
- Transformation Overlap: Multiple concurrent change initiatives make it impossible to isolate the financial impact of the specific AI project.
- Misaligned KPIs: The organization is actively tracking metrics that measure different business values.
2. Leading vs. Lagging Indicators
Traditionally, corporate metrics are split into two primary categories:
- Leading Indicators: Highly quantifiable, immediately measurable operational activities (e.g., the number of client discovery meetings).
- Lagging Indicators: Historically oriented, complex metrics that materialize with a time delay (e.g., total sales volume).
The relationship between these indicators is simple within a standard sales pipeline: while leadership ultimately only cares about sales volume, generating sales requires customer interactions. If discovery meetings drop, revenue drops. Consequently, tracking the leading operational activity provides an early warning system for the lagging financial result.
However, in the era of AI adoption, this binary model is insufficient. Which leading operational metric should you track? And how do you mathematically derive a lagging financial outcome from it? No organization has ever increased its net profit margin simply by accelerating its API token consumption. The distance between raw technological input and financial performance is too wide; it requires additional analytical layers.
3. The Metrics Framework: Input - Output - Outcome - Impact!
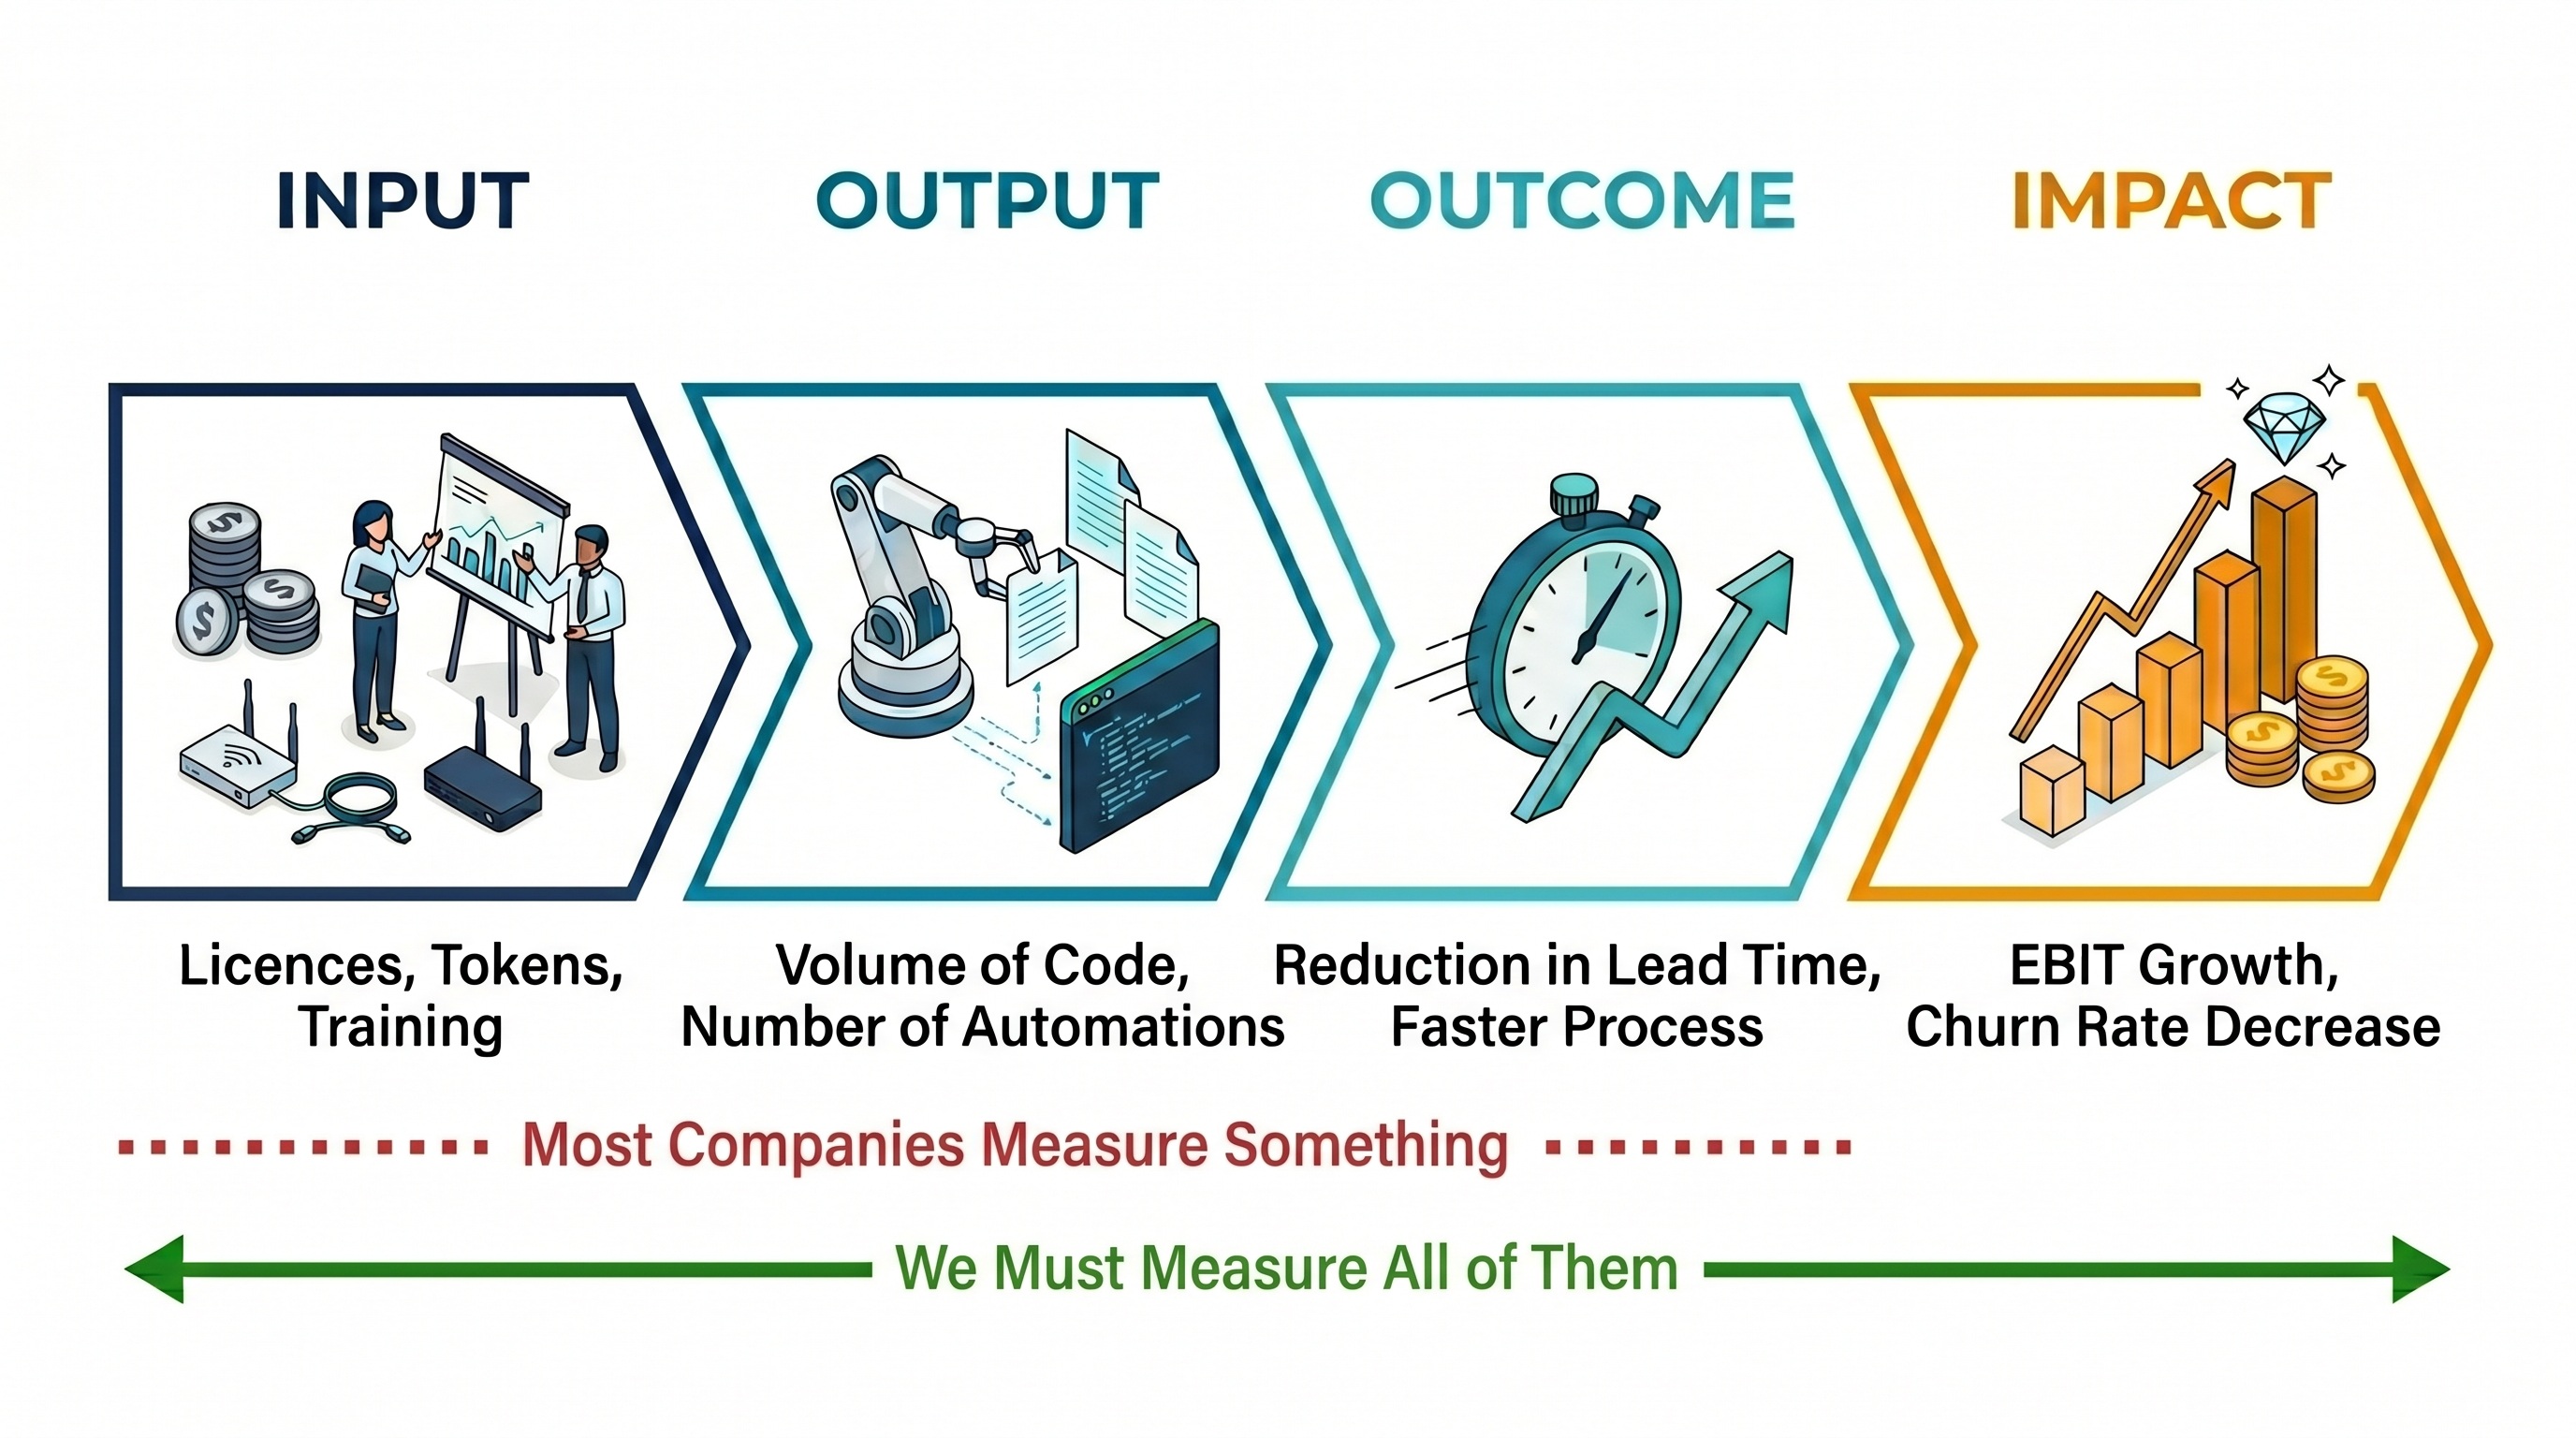
To establish a clear chain of value realization, executives must deconstruct AI transformation into four distinct logical layers.
Let us take a look at each layer individually:
The underlying logic is as follows:
- Input: We must invest in upskilling talent and allocate resources; without this baseline, AI integration cannot mature and process acceleration will not materialize.
- Output: Driven by the operational change, we execute a higher volume of specific activities that we believe will support the business.
- Outcome: We successfully achieve targeted, area-specific performance improvements exactly as intended.
- Impact: These localized improvements successfully translate into macro-level financial performance and demonstrably exceed the total cost of the transformation.
Beware: Isolating your focus onto a single, lower layer of this value chain introduces significant operational risks:
Therefore, it is crucial to measure everything down to the desired ultimate impacts.
4. Operational Roadmap for Value Realization
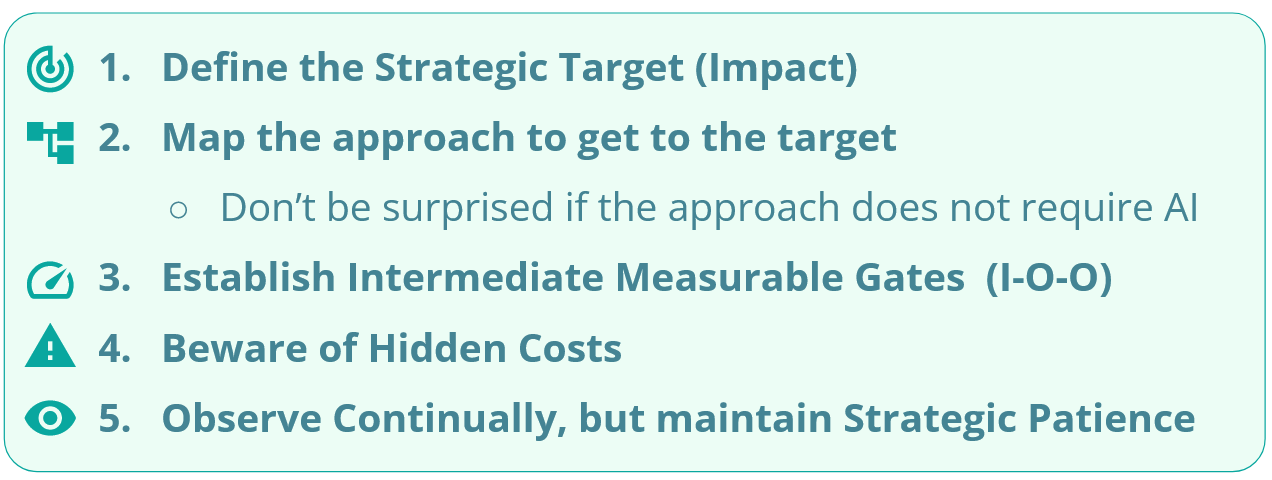
To govern AI adoption effectively, organizations must execute a structured, reverse-engineered implementation sequence:
5. Case Study: Value Stream Optimization in B2B Software Development
(The following case study aggregates experiences from our recent enterprise transformation environments).
A mid-sized software enterprise developing complex B2B systems faced intense competitive pressure. Competitors were moving faster, and executive leadership initially mandated a blanket initiative to "deploy generative AI across engineering to accelerate feature delivery."
Step 1: Define the Strategic Target (Impact)
The engineering leadership resisted the vague mandate to "write code faster" (an Output metric) and instead aligned with executive management to isolate a clear financial target (Impact). Analytical records indicated that client churn was driven by delayed deployment of regulatory compliance updates and system integrations.
- Target Impact: Reduce customer attrition (Churn Rate) by 5% and expand new business Monthly Recurring Revenue (MRR) by 12% by beating competitors to market with critical compliance features.
Step 2: Map the approach to get to the target (VSM / Issue Mapping)
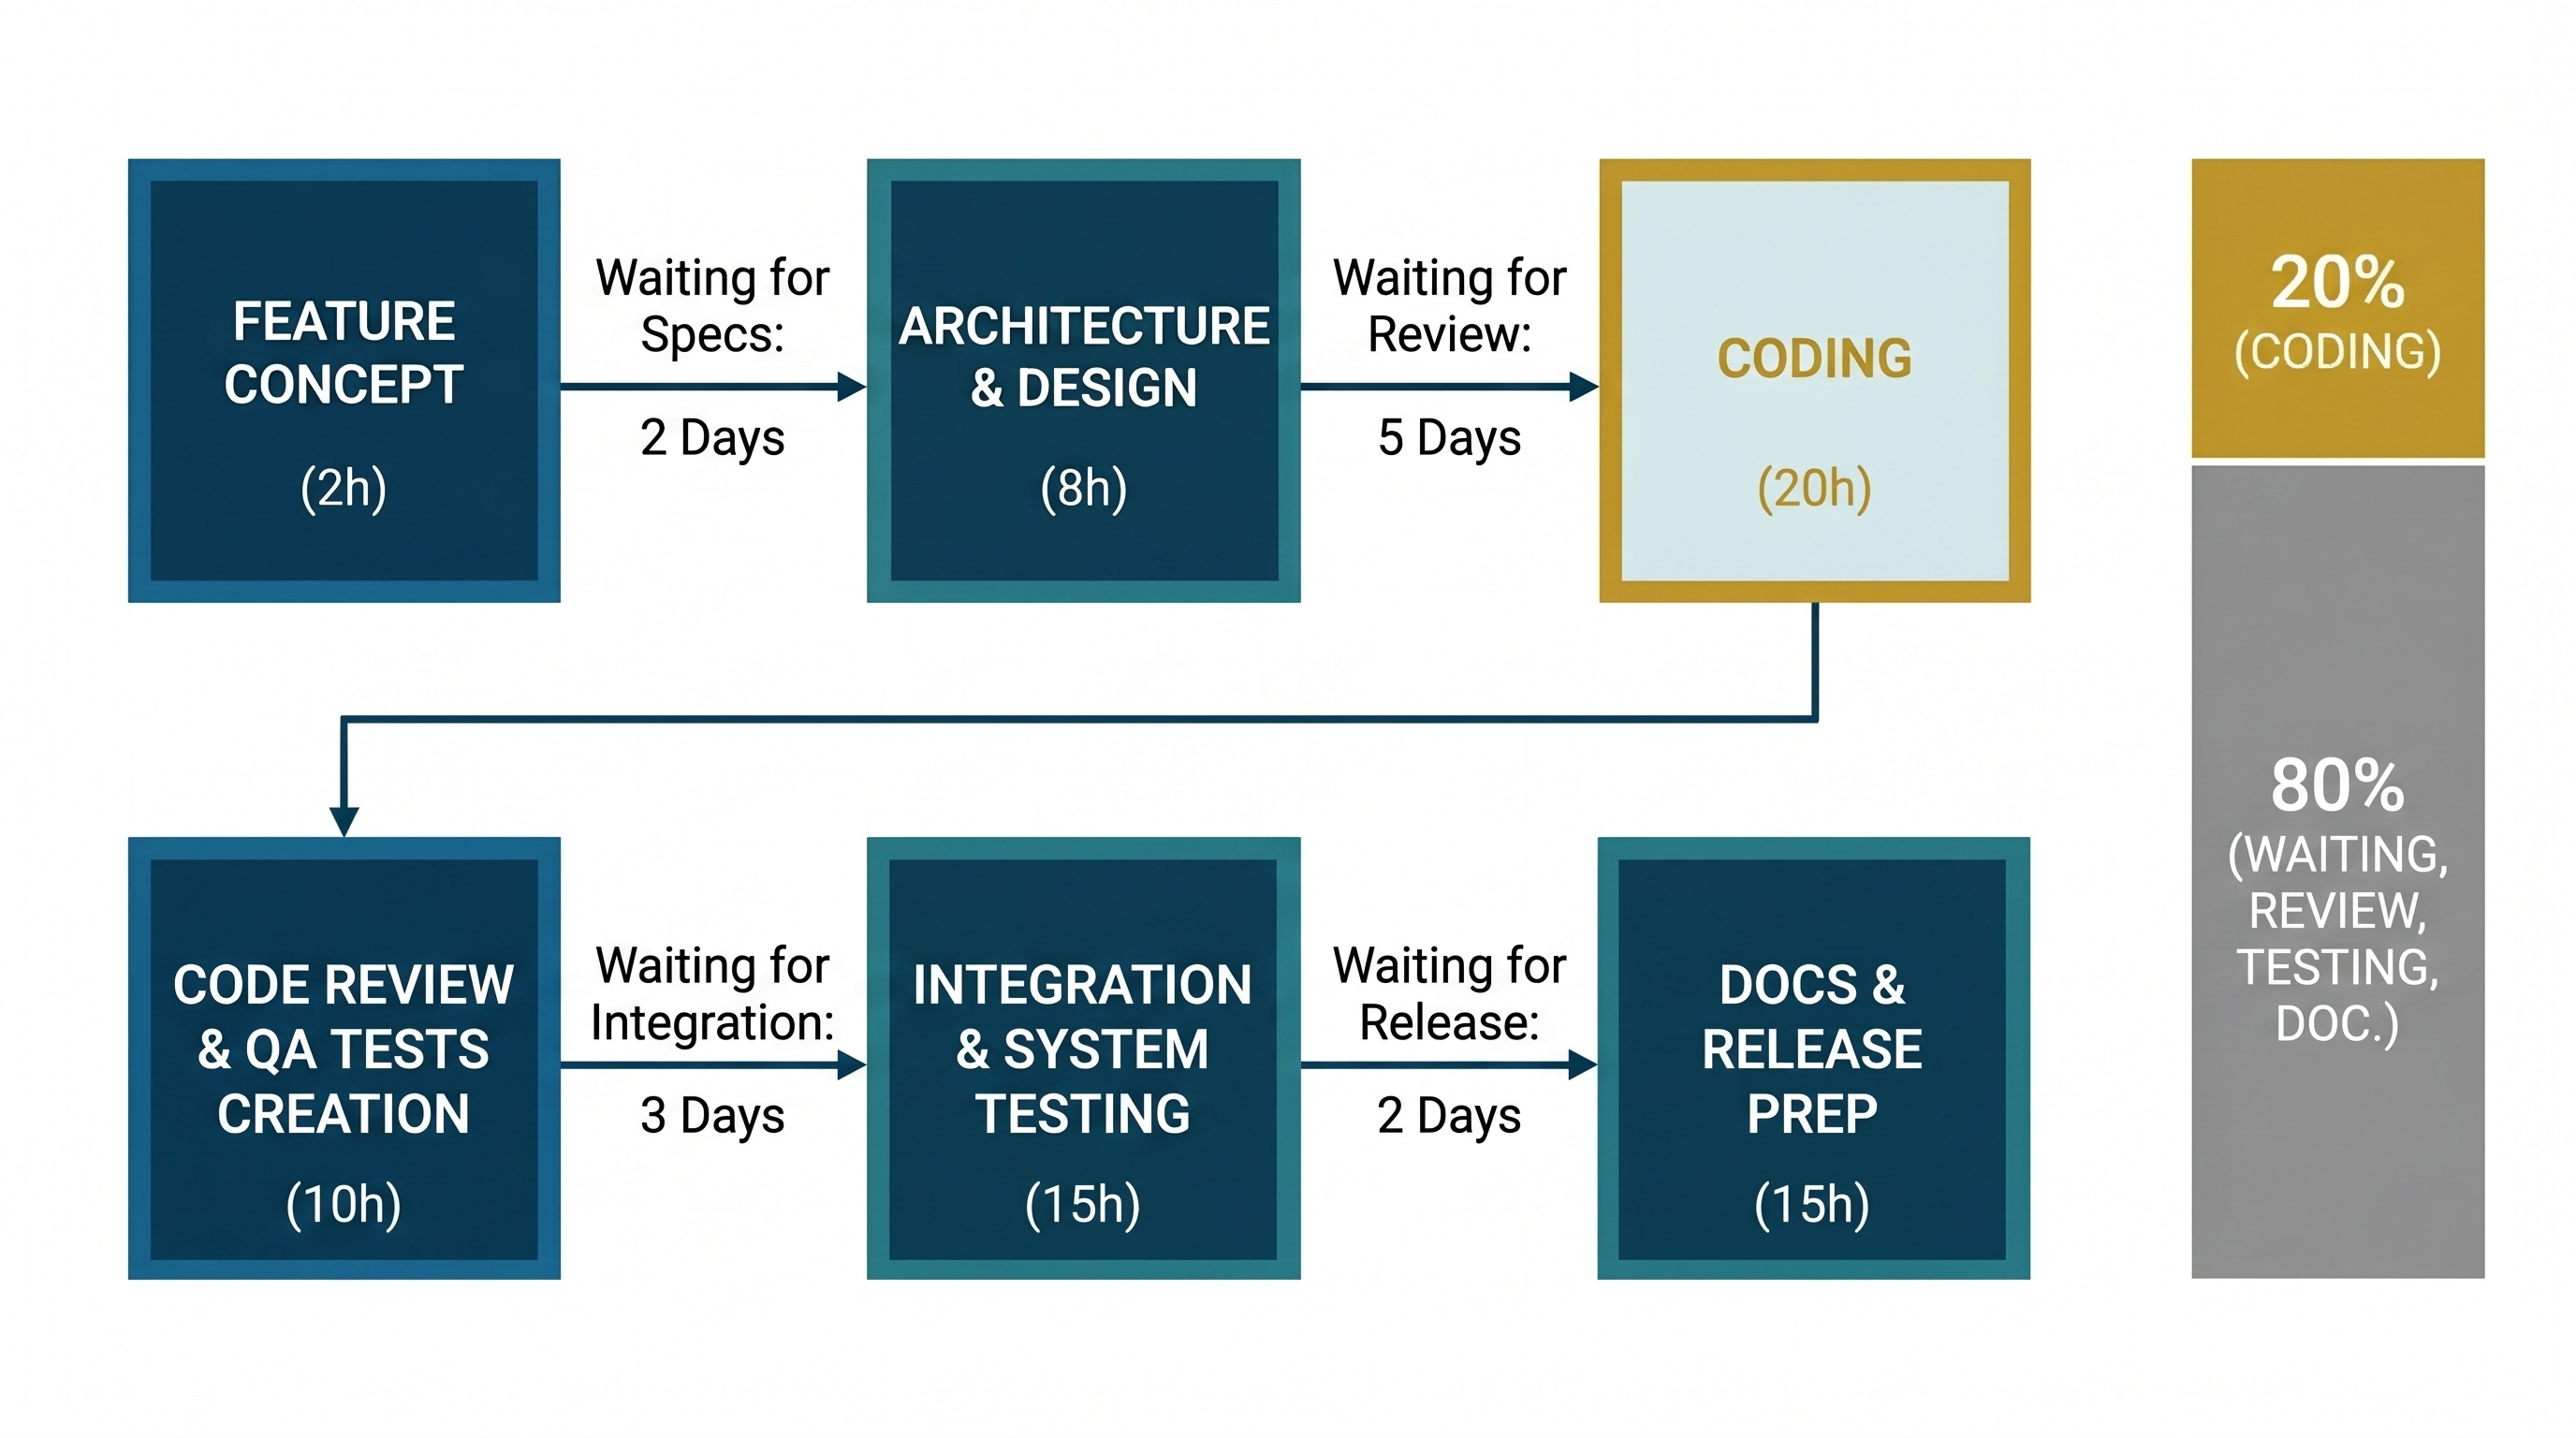
Before procuring any Claude Code licenses, the transformation team conducted an end-to-end Value Stream Mapping workshop, tracking a feature from initial concept to customer availability.
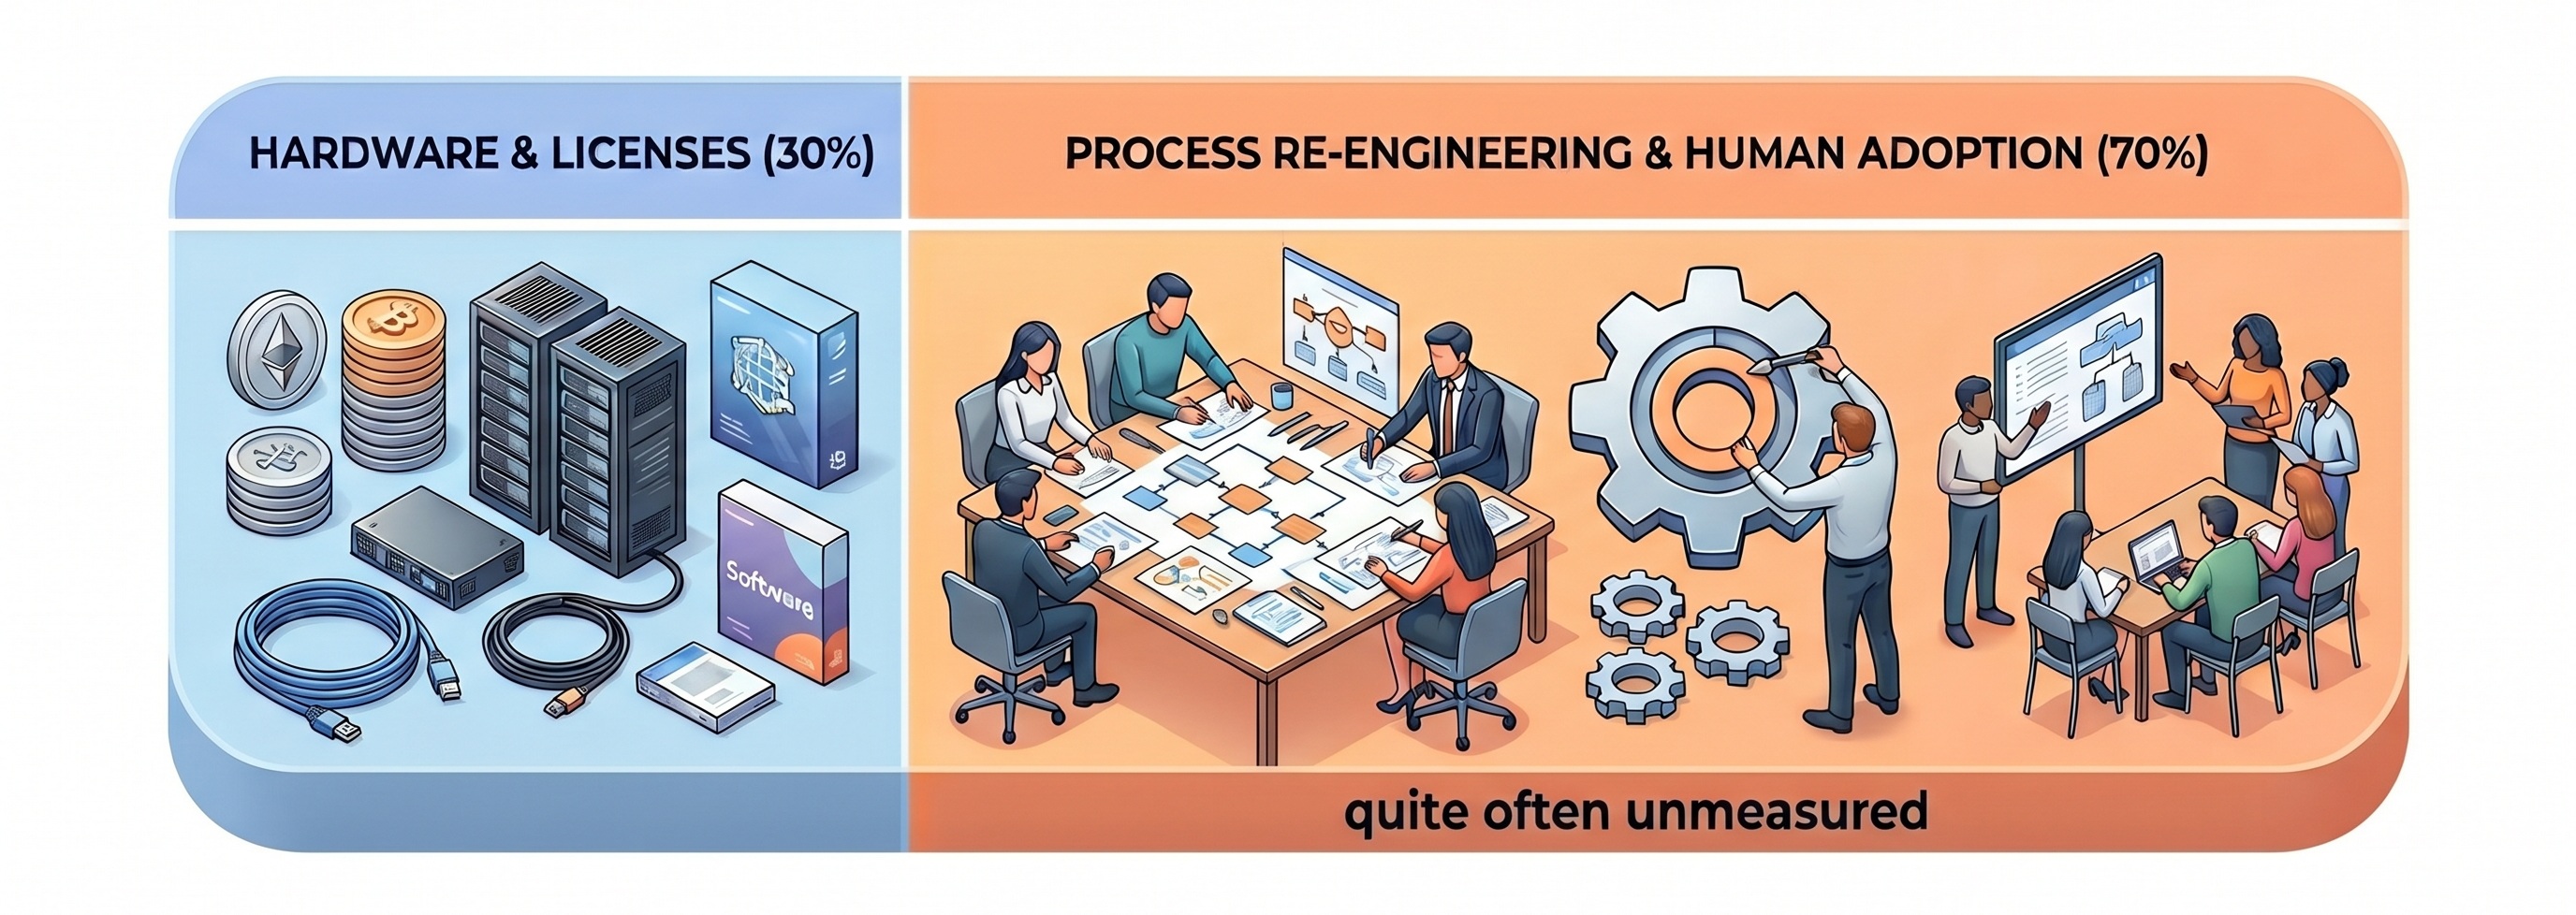
- Critical Diagnostic Finding: Pure code generation (writing lines of code) accounted for only 20% of the total cycle time. The remaining 80% was absorbed by code review queues, writing integration tests, QA validation, and drafting user documentation.
- The Local Optimization Trap: If leadership had blindly optimized code writing via AI assistants, development velocity would have increased, but the entire pipeline would have choked at the integration phase, resulting in zero net value.
- Strategic Pivot: Management re-targeted AI deployment explicitly at the primary bottleneck: automated integration test generation. Simultaneously, they eliminated documentation overhead by engineering a simple deterministic script that parsed existing test inputs to generate user guides, requiring zero AI spend for that specific task.
Step 3: Establish Measurable Gates - Input-Output-Outcome (I-O-O)
Because customer churn metrics materialize with a 6-to-9-month delay, the team structured intermediate indicators across the IOOI framework:
Step 4: Beware of Hidden Costs!
Management avoided the fallacy of assuming that instantaneous AI code generation equates to free capacity. They rigorously calculated the hidden operational friction:
- Human-in-the-Loop Overhead: While integration engineers saved 3 hours on initial generation, senior analysts had to dedicate 45 minutes to comprehensive code reviews and behavioral verification to eliminate subtle model anomalies and logical drift.
- Maintenance and Prompts: Engineering capacity was allocated to adjust prompt libraries and middleware connectors when foundational models updated.
- Net Value Realization: The net engineering capacity expansion was not the idealized 50% claimed by tool vendors, but a realistic, sustainable 25% net capacity lift.
Step 5: Observe Continually, but maintain Strategic Patience (J-curve)
- Months 1 & 2 (The Performance Trough): Engineers struggled with environment configurations, prompt engineering nuances, and initial syntax conflicts. Change Lead Time spiked from 28 days to 37 days. Operational performance deteriorated. An uncalibrated management team would have canceled the project here, citing technology failure. This leadership team, however, anticipated this as a necessary transformation tuition cost, provided targeted expert support, and helped to stabilize the workflow.
- Month 3 (The Turning Point): The group stabilized its prompt databases and shared deployment templates. Change Lead Time returned to the historical baseline of 28 days.
- Month 4 (The Value Acceleration): Automated test pipelines and standardized documentation loops achieved fluidity. Change Lead Time dropped to 13 days, accelerating production cycles by more than half.
- Month 6 (Macro Impact Realization): Account management and commercial teams confirmed a structural turnaround: feature responsiveness stabilized key accounts, reducing Customer Churn Rate by 5.5% and successfully exceeding the strategic milestone.
Proper measurement and a thorough understanding of the J-curve navigated the organization through the 'valley of death' to its desired success. Along the way, however, they encountered the numerous 'hidden costs' that are prevalent in AI transformations.
6. The Taxonomy of Hidden Transformation Costs
As demonstrated in the case study, ignoring invisible operational variables will severely degrade financial projections. Comprehensive financial modeling must account for the full cost architecture:
- Cognitive Re-Structuring Friction: Transitioning to an AI-first workflow requires shifting from execution to delegation and comprehensive intent specification. This structural shift introduces severe cognitive load. Certain high-performing individual contributors experience an innate inability or strong resistance to operating as editors rather than authors, leading to team friction, performance drops and possible attrition.
- Continuous Upskilling Expenses: Model architectures, API specifications, and context engineering standards evolve rapidly. Upskilling talent is a perpetual operating expense, not a one-time capital investment. Data confirms that training and enablement costs regularly exceed software licensing fees by orders of magnitude.
- Orchestration and Tool Sprawl Overhead: Beyond seat-based subscriptions, running complex agents introduces significant auxiliary expenses, including custom middleware development, security architecture audits, consulting costs and model monitoring infrastructure.
- Induced Secondary Expansion: Deploying a high-velocity code generation engine introduces immediate downstream requirements. If you accelerate code output, you are forced to expand your continuous integration computing power, log storage capacity, and verification environments—infrastructure costs that are rarely visible in the initial software vendor quote.
- The Instability and Correction Premium: Advanced models lack (so far) infallible deterministic common sense. If an agent is given an ambiguous command that intersects with destructive access parameters, it will execute it without hesitation. Managing this architectural volatility requires continuous governance, guardrail engineering, and unexpected remediation hours. See more in recent news about service drops in GitHub, Cloudflare and AWS.
- Domain Expertise Atrophy: When a highly repetitive but foundational task is delegated entirely to automated workflows, junior talent stops developing deep, native context in that domain. Over a multi-year horizon, this creates a severe talent risk, as the organization depletes its internal pool of senior validators who possess the foundational knowledge required to audit model outputs.
- Strategic Opportunity Cost: Capital and engineering bandwidth allocated to foundational data formatting and model prompt tuning cannot be deployed toward alternative business initiatives. Organizations must calculate what revenue-generating features were shelved to fund the AI infrastructure.
- Junior Velocity Overload: Robust model augmentation allows junior engineers to generate code volumes historically reserved for senior developers. However, this high volume frequently contains subtle architectural flaws, overloads senior engineers with excessive code review duties, and creates a severe bottleneck in senior capacity.
- Legal, Regulatory, and Compliance Volatility: The global legal landscape regarding algorithmic data usage, IP ownership of generated code, and compliance liability is highly volatile, requiring ongoing legal review and introducing unpredictable litigation risks.
- Hidden Infrastructure Externalities: High-density computational processing carries significant environmental and energy requirements. While handled by cloud providers, these factors present material risks to corporate sustainability metrics, internal employee alignment, and carbon-border ESG compliance ratings.
The Strategic Silver Lining: Invisible Benefits
- Process Rigor: Interacting with automated agents forces everyone to explicitly document inputs, outputs, and boundary conditions. This implicit drive toward process transparency resolves deep-seated architectural debt.
- Delegation and Leadership: Operating advanced assistants transforms individual contributors into leaders, orchestrators and evaluators, rapidly accelerating the development of delegation, systems thinking, and leadership competencies.
7. Reality: What to do with Existing Unmeasured AI Initiatives?
If your organization has already scaled its AI expenditures without establishing preliminary baseline metrics, immediate remediation is required through a reverse-engineered IOOI analysis:
- Reconstruct a Proximate Baseline: Do not stall progress searching for immaculate historical metrics. Extract any rolling historical records, project delivery frequencies, or past budgetary parameters to build a functional approximation of the "before" state. A coarse baseline established today is vastly superior to a perfect baseline that never materializes.
- Isolate the Value Hypothesis (Impact): Clearly define what macro-level financial outcome or competitive parameter the AI transformation is intended to optimize.
- Audit True Total Cost of Ownership: Catalog all indirect seat licensing, token fees, auxiliary infrastructure computing expenses, and human review hours currently absorbed by the initiative.
- Execute an Executive Evaluation: Determine whether the current value stream throughput justifies the fully loaded operational cost architecture.
- Calibrate the Roadmap Forward: Utilize this data to pivot your strategy—either by aggressively targeting unaddressed processing bottlenecks to expand Impact, or by streamlining operational tooling to lower expenses while preserving your baseline value.
8. Strategic Conclusion
Establishing absolute transparency over AI adoption metrics is no longer an optional technological exercise; it is a foundational requirement for corporate capital governance. Advanced models have transitioned from speculative experiments into permanent infrastructural reality, mirroring the historical integration of enterprise internet and mobile communication frameworks.
The primary question for executive leadership is no longer whether to deploy advanced automation, but how to rigorously govern its integration. By leveraging the structured architecture of the IOOI framework, leadership teams can ensure that process re-engineering delivers a measurable, non-diluted expansion of enterprise EBIT rather than an unmitigated growth in structural operating expenses.
Discover your AI adoption level based on our model, and get a few useful adoption tips at the same time: https://ai-adoption.rainfellows.cz/.
Appendix 1: Enterprise AI Metric Taxonomy
This index serves as an executive reference matrix designed to help technology and financial leaders construct balanced corporate dashboards across the IOOI spectrum.
A1.1. Input
Indicators of resource allocation, capital deployment, and early adoption velocity.
A1.2. Output
Quantitative performance metrics tracking the immediate, unvalidated volume of deliverables produced by inputs.
A1.3. Outcome
Area-specific indicators tracking localized behavioral modifications, operational cycle times, and transactional quality.
Example: Customer Service & Operational Workflows
Example: Software Engineering & R&D Workflows (DORA Metrics)
A1.4. Impact
Global lagging indicators demonstrating macro-level shifts in corporate profitability, long-term market position, and shareholder value.
Operational Note regarding Non-Profit or Public Sector Frameworks: For enterprises operating under non-commercial charters, the Impact layer must pivot to evaluate fulfillment of their core organizational mission (e.g., public service delivery velocity, regulatory compliance rates, or patient recovery volumes).
Strategic Clarification: Misclassified Indicators
The following metrics are frequently misclassified as true Impact indicators, but properly should reside at the Outcome level, as they serve as mere intermediate drivers for global financial performance: